Posted On March 23, 2021
The LRE Water Groundwater Team's Cool and Weird Plots of 2020
2020 sure was a strange year for us all, and the strange vibes seemed to creep into our work as the Denver Groundwater Team evaluated and communicated the complex hydrogeology and geochemistry data we analyze on a daily basis. Looking back on our portfolio of work, we created a number of really cool, and sometimes equally weird, graphs, plots, and figures. Inspired by the great work done at FiveThirtyEight.com, we wanted to share with you our most exciting, and often equally weird, plots of 2020!
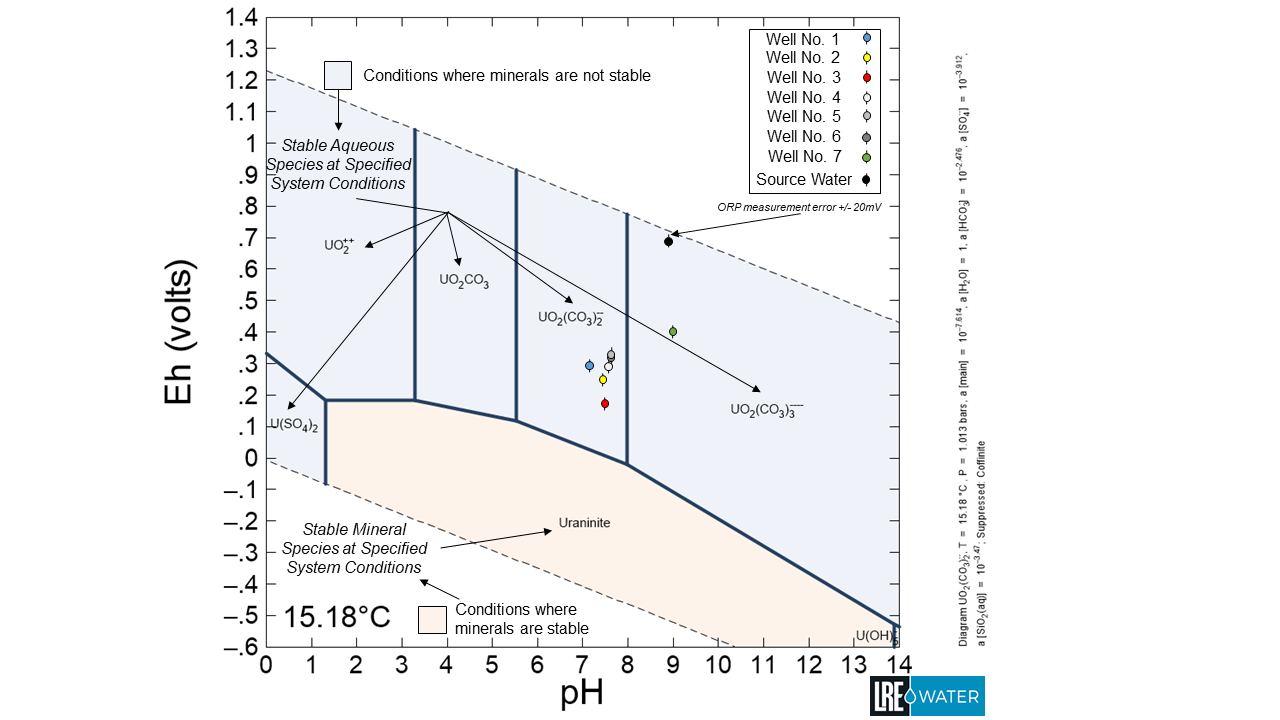
Allan Foster, EI - Staff Hydrogeologist: One of the key questions that LRE needs to answer as part of evaluating an aquifer storage and recovery project is “how will the source water react with the aquifer material when stored underground”? Naturally occurring trace metals in the rock or soil, such as uranium, have the potential to mobilize when you introduce oxidizing water into the aquifer. Allan developed this Eh-pH (redox potential relative to the standard hydrogen electrode versus acidity or basicity) diagram to evaluate both the existing aquifer conditions and conditions where source water is introduced with respect to uranium-bearing mineral stability and expected aqueous species under equilibrium conditions. Allan not only loved the unique nature of this graph, but the amount of work that went into developing it, which included just a little field work: well drilling and testing, water quality sampling, laboratory geochemistry analysis of aquifer material, and geochemical modeling.
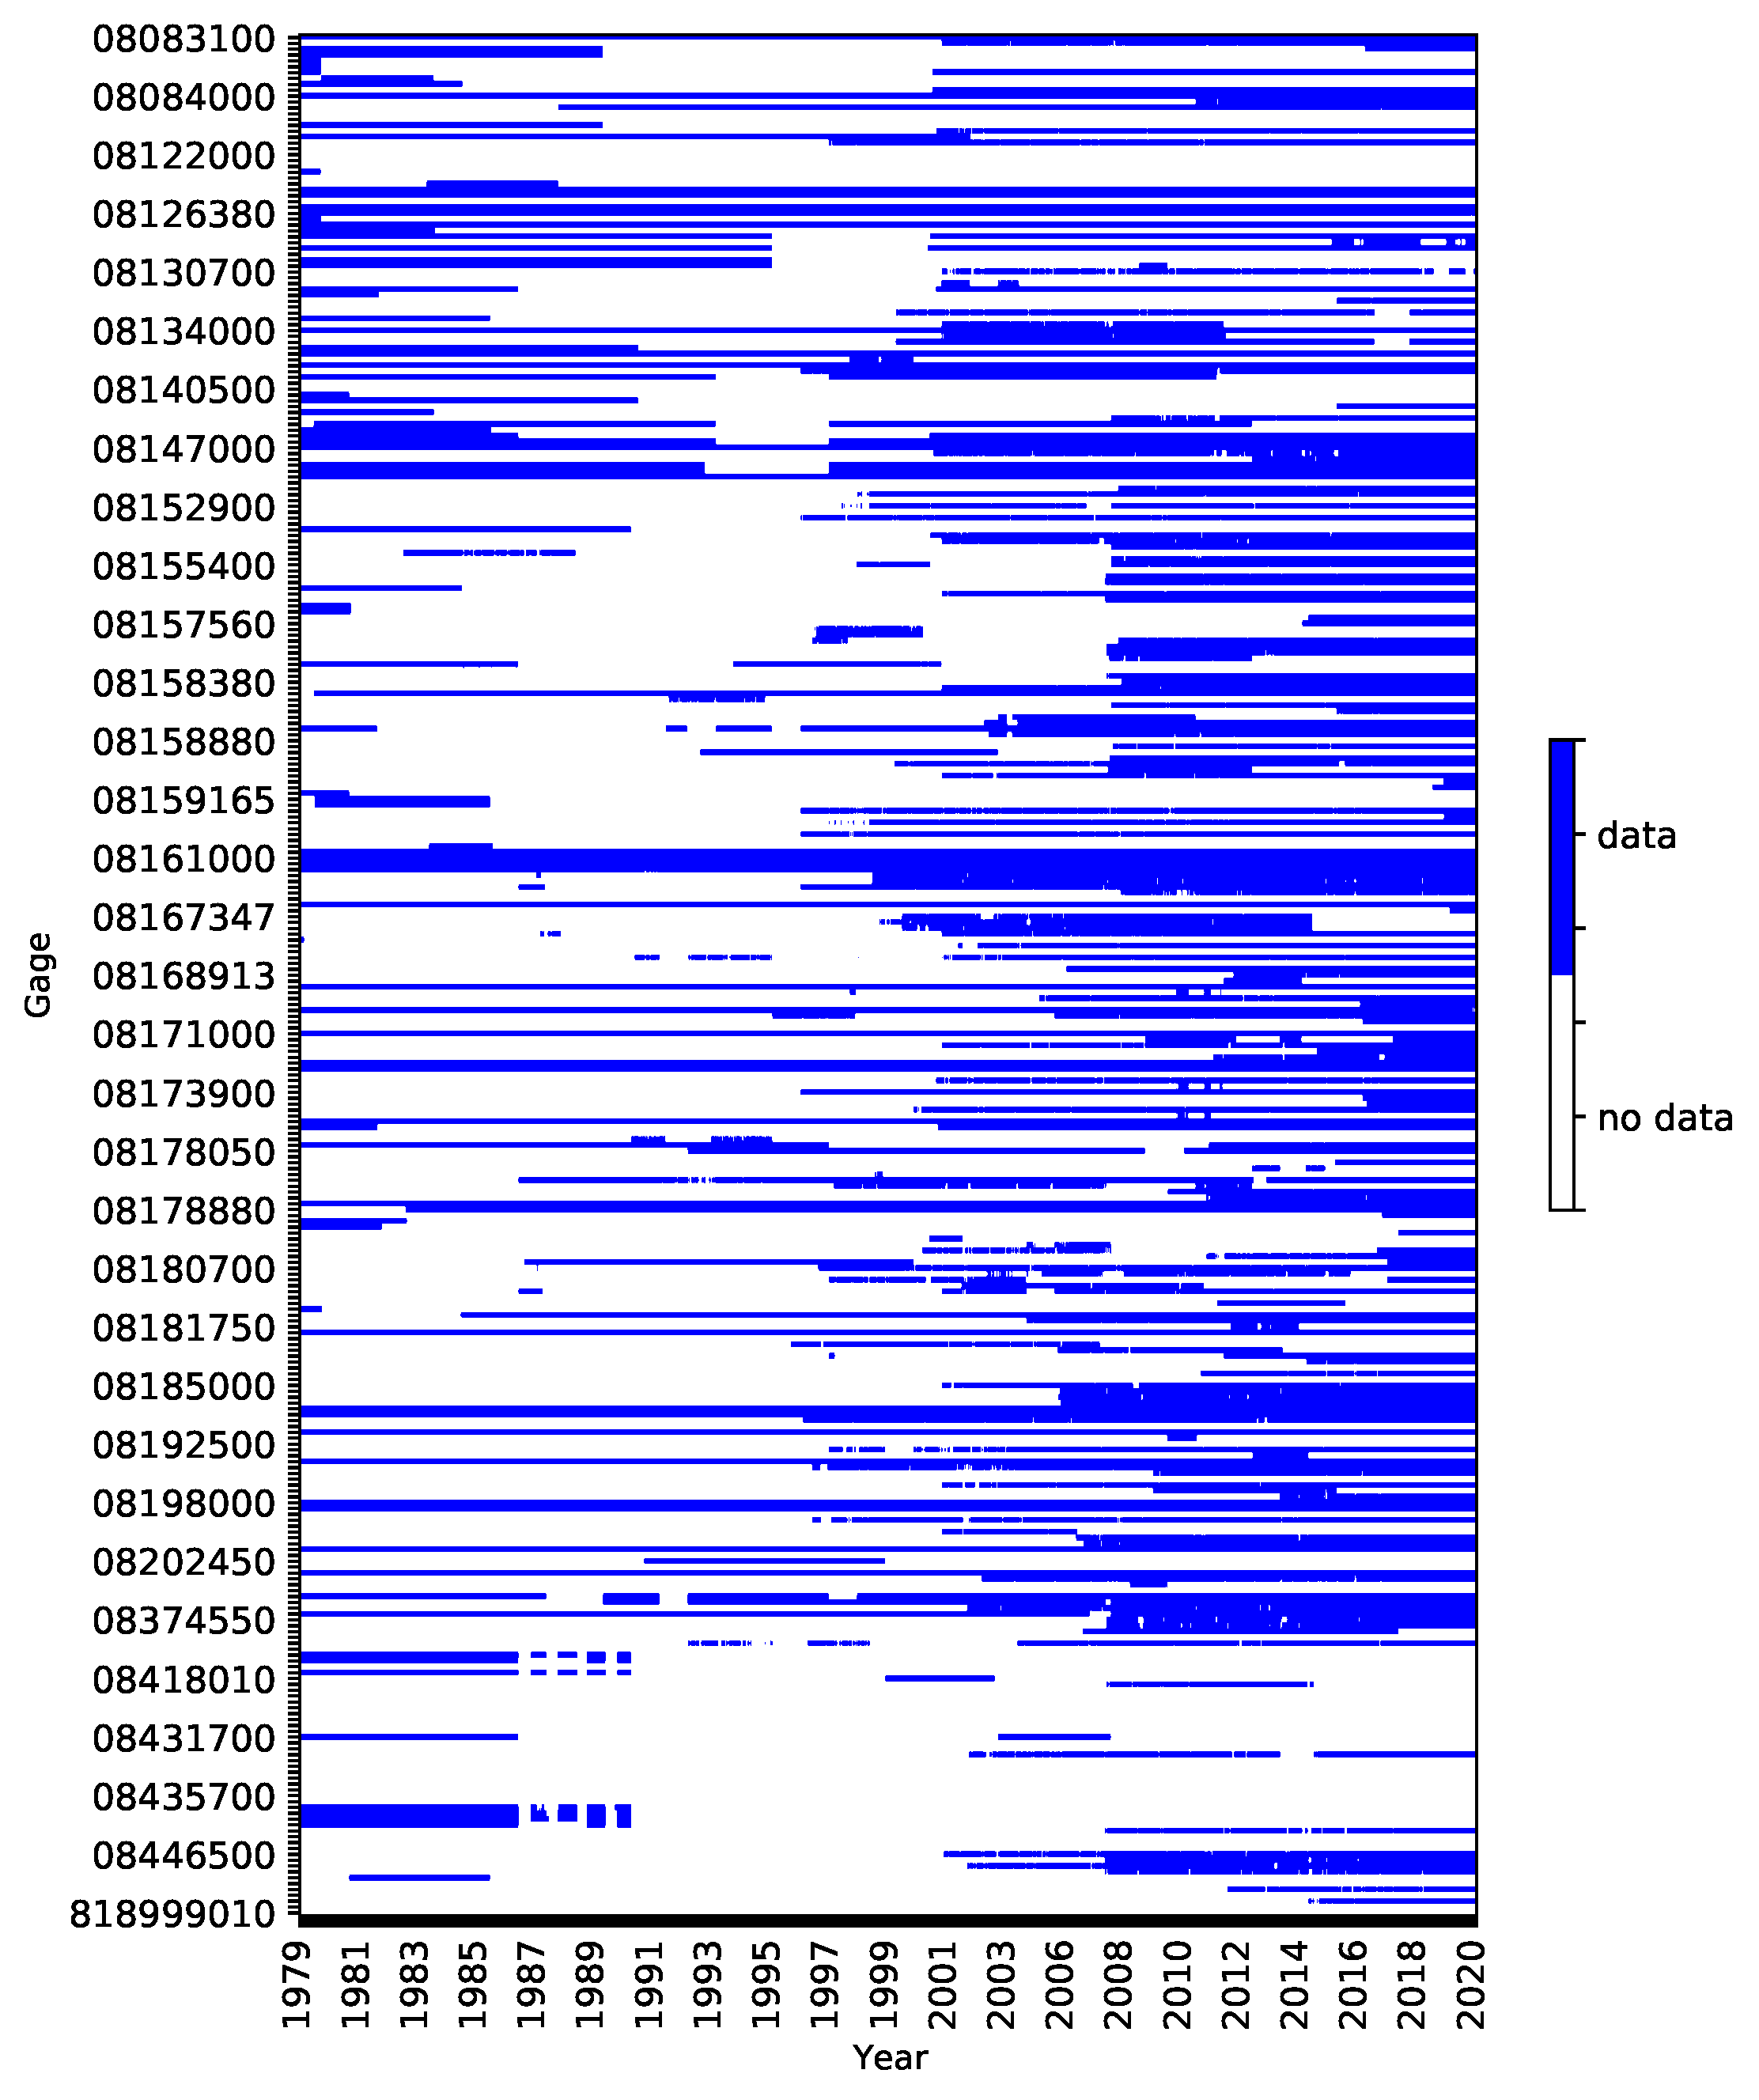
Matt Sparacino - Staff Hydrologist: In the world of “Big Data,” even geologists can’t escape having to try to find the preverbal signal in the noise. To handle big data sets, the LRE team uses a variety of Python packages to analyze and visualize large data sets. Matt Sparacino was trying to understand what streamflow data was available over the past 40-plus years from over 300 stream gage locations. To quickly identify what data was available, and where he had data gaps, Matt developed this sort of heat map that shows when streamflow data is available (blue cells) and where there is no data (white cells). Matt used this table to quickly identify which stream gage stations have a robust data set, and which have relatively little available data.
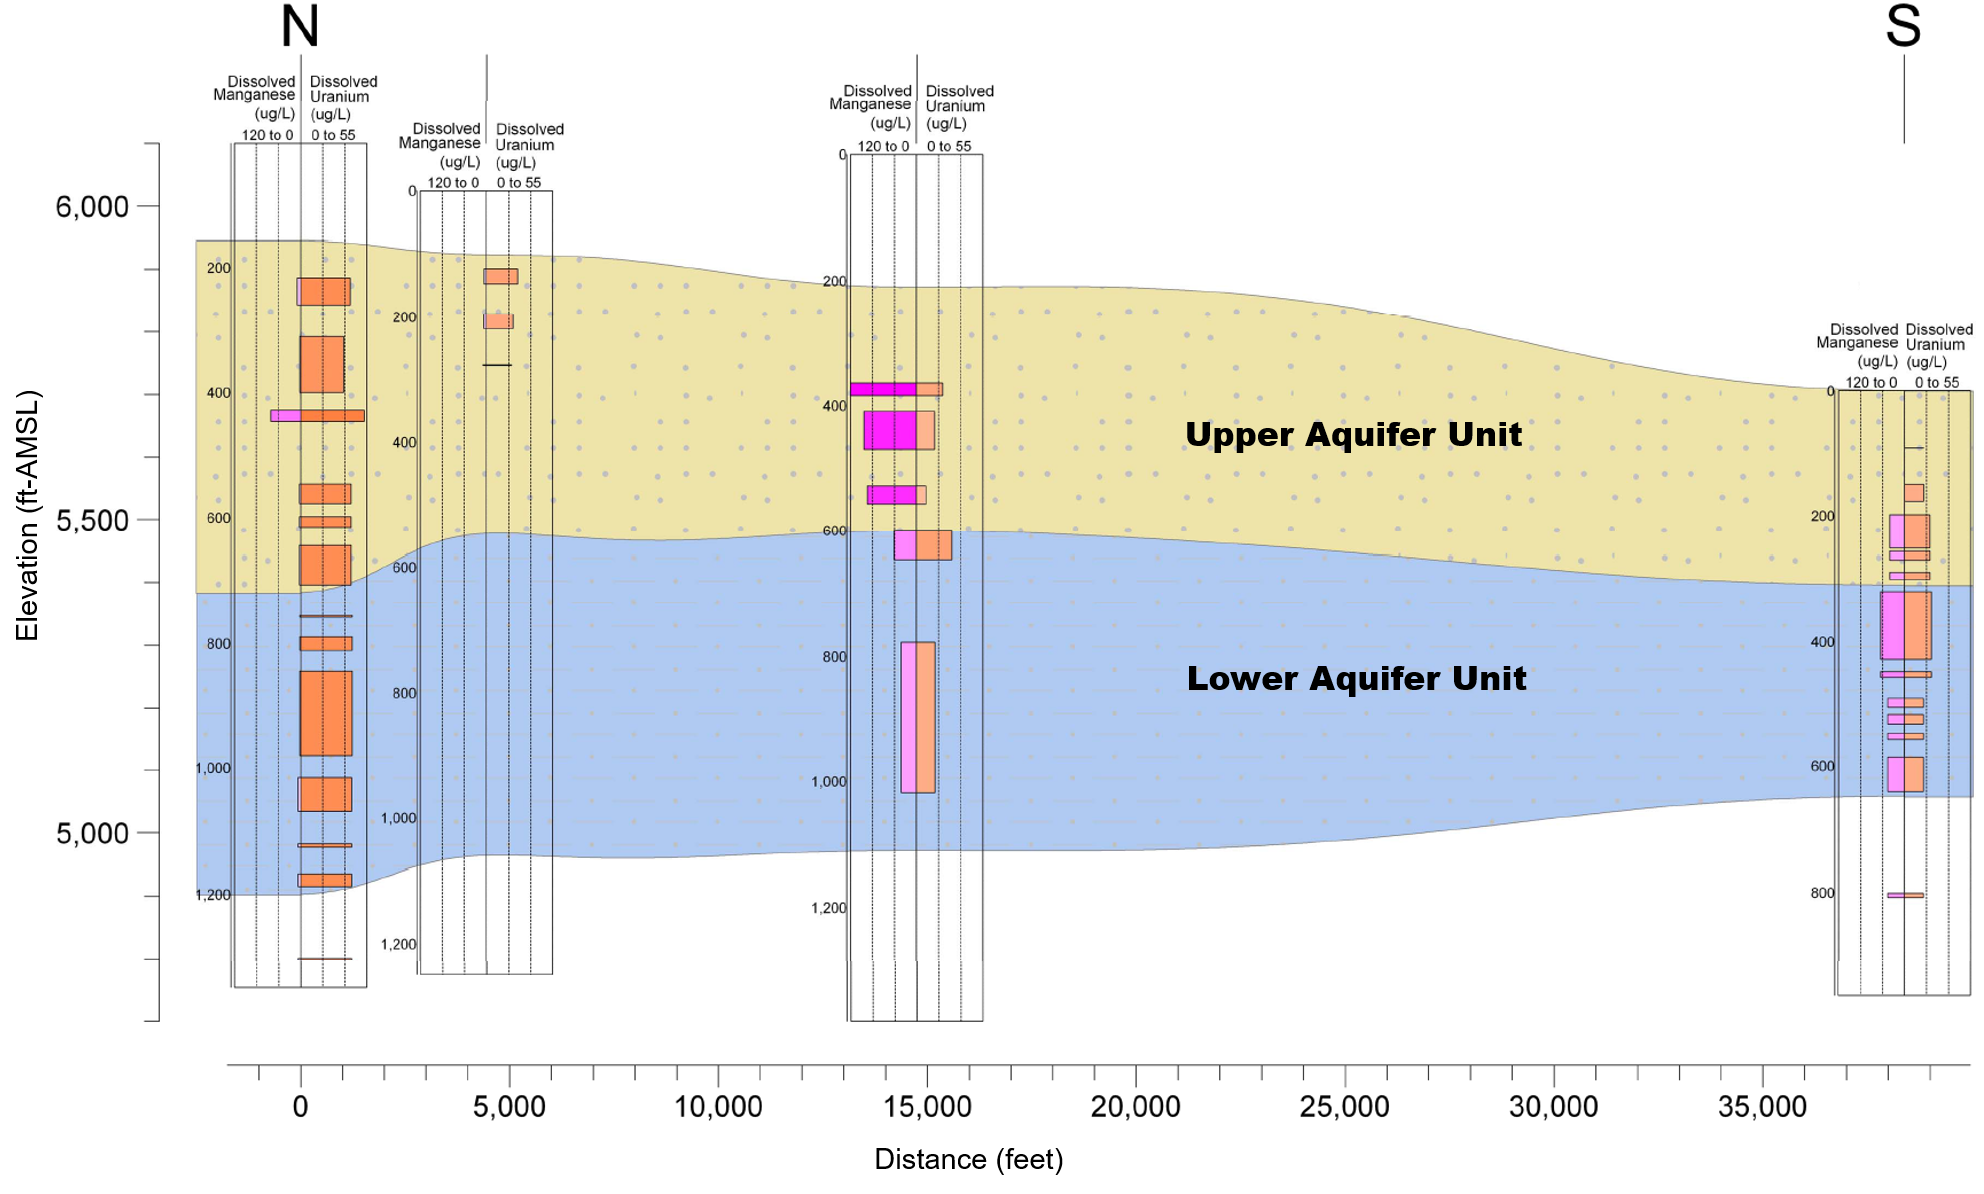
Clinton Meyer - Staff Hydrogeologist: One of the challenges we face in hydrogeology is that things change over space, and time, and we have to understand how those variations affect our clients water supply. Clinton Meyer developed this cross section to understand how naturally occurring manganese and uranium concentrations in an aquifer varied across a site as well as with depth in the aquifer. In this case we found that the uranium and manganese is fairly consistent in space and depth, but it is common that these trace metal concentrations may be isolated in an individual sand package, or even along a single bedding plane within a sand package. By understanding these variations, Clinton can design a well that optimizes both the water quality and yield.
Jacob Bauer, PG - Project Manager and Groundwater Modeling Practice Lead: Jacob Bauer has spent much of his 2020 transforming the groundwater teams modeling practices using FloPy, an integrated python and MODFLOW approach to groundwater modeling. Using FloPy, Jacob has developed time lapse video visualizations of groundwater flow. These videos have been particularly powerful for evaluating and visualizing groundwater and surface water interactions. This video shows the mixing of surface water and groundwater in response to pumping an alluvial well. Understanding groundwater and surface water interactions are critical for our client as they drive our clients decisions related to water rights, wet water supply, and water quality.
Click the video below.
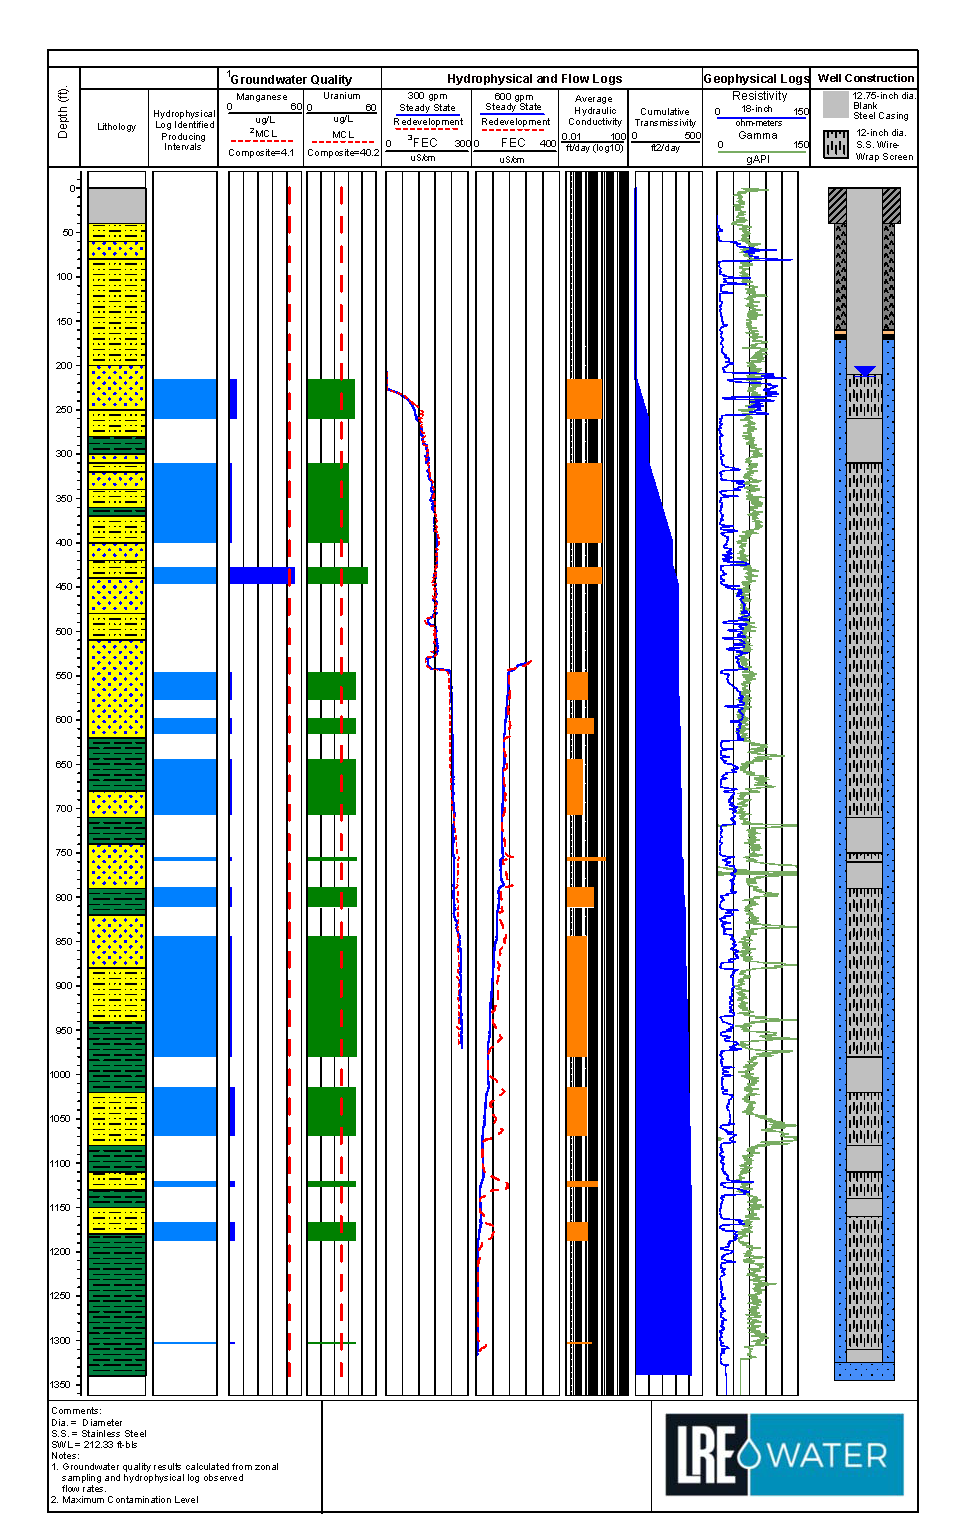
Joel Barber, PE - Senior Hydrogeologist: Sticking with the “big data” trend, when we drill and test a well we often get a massive quantity of data that is difficult to view and analyze. These data are often interconnected and we need to look at all of the data in combination to best understand the well and aquifer system. We have begun combining these large data sets into individual well data summary figures. In this figure we show lithology data, logged by our field geologist during well drilling, geophysics, aquifer testing, water quality, and well construction details, all in one figure. It may seem like a lot of data, and it is, but we have found these figures to be powerful tools for not only quickly presenting large amounts of well data, but also allowing a viewer to quickly compare the various data sets to each other.
Although we are hoping for a more normal 2021, we are continuing to utilize our teams data analysis tools to develop cool and weird plots to help our clients understand complex hydrogeologic data. And thank you to the alway fantastic website FiveThirtyEight.com for the inspiration for this blog post.